Europa Universalis IV

Europa Universalis IV

76 人が評価
EU4 Advanced Economics 1. Province development
作者: werogatda
What provinces should you develop? What buildings should you build? Are Manufactories overrated? Should you get a loan or debase currency? These questions are answered over a series of guides. For players looking for nothing less than mathematical precision in their EU4 economy management.
   
アワード
お気に入り
お気に入り
お気に入りから削除
Introduction
Gday fellow conquerors,

I am starting a series of guides on the economic side of EU4.
If you are a min-max fanatic like me, you will like my guides.

This guide is written for version 1.29. I know 1.30 patch is coming up, I will update the guide when the new patch is out to make sure they are compatible.

The first topic is regarding province development. In the Develop Province tab, the game allows you to align your provinces in the order of Monarch Point efficiency so that you can tell at a glance which provinces you should be developing first.

But are these alignments accurate?
Base Tax Development
France at the 1444 start date is shown as an example.

Open the Develop Province tab, then align by Local Tax Value.


According to this list, Narbonnais is the most cost-effective province when developing Base Tax. Spending 53 Admin Power is supposed to improve the Monthly Tax Income of Narbonnais by $0.09 per month.

I developed an Excel table to calculate the actual change in tax income for the top 10 provinces from the list, from Narbonnais to Vivarais.


  • For provinces controlled by Clergy, autonomy is assumed to be 0, as Clergy estate does not affect tax income.
  • Teff = Tax Efficiency
  • $T/m = Monthly province tax income
  • $T+1/m = Monthly province tax income, after developing the province by 1 Base Tax
  • d$T/m = Difference in monthly province tax income, after developing the province by 1 Base Tax
  • DC = development cost
  • (d$T/m)/DC = Difference in monthly province tax income, divided by the development cost

Do refer to EU4 wiki Tax page (https://eu4.paradoxwikis.com/Tax) for formulas required to calculate tax income.

You can see that d$T/m (the column highlighted in green) matches Predicted increment (also highlighted in green), meaning that the game makes an accurate prediction of the increase in provincial tax income. Note that in the game, up to 2 decimal points are displayed. 3 decimal points are discarded, rather than being rounded up or down.

(d$T/m)/DC (the column highlighted in yellow) matches Predicted order (also highlighted in yellow). This means that the provinces are aligned in the correct order of Monarch Point efficiency.

Narbonnais should be the first province to have its Base Tax developed, as this will give you the most value for your Monarch Points.

BTW, there is an error in the way the game displays provincial Tax income. See below:


Annual Tax income of Paris should be 8 (Base Tax) x 1.15 (Tax Efficiency) x 1 (autonomy) = $9.2, but is displayed as $9.15 in the tooltip. A similar error exists for Production income as well - see the next section.

Note that an increase in Base Tax will will also cause a minute rise in trade income because boosting total development of a province raises provincial trade power. The actual boost in Trade income is minute, and is not considered in this guide.
Base Production Development
Let's look at Base Production development.

Again, you can align the Develop Province tab by Local Production Value. Chartres is supposed to be the most cost-effective province to develop, followed by Paris and Saintonge.


I took the top 10 provinces from this list and calculated their Production income. The top table is using the starting Production level. The bottom table is when the Base Production levels have been developed by 1.

  • For provinces controlled by Burghers, autonomy is assumed to be 0, as Burgher estate does not affect production income.
  • GPeff = Goods Produced Efficiency
  • GP = Good Produced
  • Price = Market price of the resource produced by the province
  • Peff = Production Efficiency
  • $P/y = Annual production income
The results of the two tables above are compared in the table below.

  • d$P/y = Difference in annual province production income, after developing the province by 1 Base Production
  • d$P/m = Difference in monthly province production income, after developing the province by 1 Base Production
  • DC = development cost
  • (d$P/m)/DC = Difference in monthly province production income, divided by the development cost
Do refer to EU4 wiki Production page (https://eu4.paradoxwikis.com/Production) for formulas required to calculate production income.

You can see that d$P/m (the column highlighted in green) does NOT match Predicted increment (also highlighted in green), meaning that the game fails to make an accurate prediction of the increase in provincial Production income.

(d$P/m)/DC (the column highlighted in yellow) SORT OF matches Predicted order (also highlighted in yellow) but is not entirely accurate.

A vaguely accurate list is better than no list, so if you need to dump some leftover Diplomatic Power into development, you can still follow the list.

An increase in Base Production also raises Trade income (due to higher provincial Trade Power and Trade Value). Therefore, if two provinces are projected to have similar boosts in Production income, you should prioritise the province that will have a higher boost in Trade income (provinces in your Home Node, Centres of Trade, Estuaries etc.)

Provincial Production income is displayed inaccurately in the province tab tooltip. For example, the annual production of Saintonge should be $2.04, but it is displayed as $2.02. See below:


Annual Production income for Saintonge in Year 144 should be:
Base Production (4) x 0.2 x Market price (2.5) x Production Efficiency (1.02) = 2.04
But it is shown as 2.02.
Base Manpower Development
Let's look at Manpower.

Align your provinces in the order of Local Manpower Value. Montpellier is supposed to be the most cost-efficient when developing Manpower.


The following is a table calculating the actual increase in Manpower, for the top 10 provinces from the list.


  • MPeff = Manpower Efficiency
  • MP = Maximum Manpower for the province
  • MP+1 = Maximum Manpower after developing the province by 1 Base Manpower
  • dMP = Difference in Maximum Manpower, after developing the province by 1 Base Manpower
  • DC = development cost
  • dMP/DC = Difference in Maximum Manpower, divided by the development cost
Do refer to EU4 wiki Manpower page (https://eu4.paradoxwikis.com/Manpower) for formulas required to calculate Manpower.

You can see that dMP (the column highlighted in green) matches Predicted increment (also highlighted in green), meaning that the game makes an accurate prediction of the increase in provincial Manpower.

dMP/DC (the column highlighted in yellow) matches Predicted order (also highlighted in yellow). This means that the provinces are aligned in the correct order of Monarch Point efficiency.

Montpellier should be the first province to have its Base Manpower developed, as that will give you the most value for your Monarch Points.

Note that an increase in Base Manpower will also cause a minute rise in trade income because boosting total development of a province leads to greater trade power for that province.
Conclusion
When you align the provinces in the Develop Province tab:
  • Local Tax Value: alignments are accurate. You should preferentially develop the provinces at the top of the list.
  • Local Production Value: alignments are roughly accurate. You should preferentially develop the provinces at the top of the list, while also considering strategically important locations for trade.
  • Local Manpower Value: alignments are accurate. You should preferentially develop the provinces at the top of the list.
  • In-game displays for provincial Tax and Production income are inaccurate. FIX IT PARADOX!

Links to the rest of my guides: EU4 Advanced Economics
1. Province development
2. Buildings Part I
3. Buildings Part II
4. Manufactories
5. Light Ships
4 件のコメント
Lord 2021年11月23日 21時42分 
i feel like i am reading a economics thesis
Gebba 2020年5月18日 12時27分 
Yep, what SkeL said. I expected this to be, well, advanced economics, but this isn't even a guide or a tip for how to efficienty spend or gain resources. The conclusion is that you can safely spend MP on developing what the game tells you to develop.

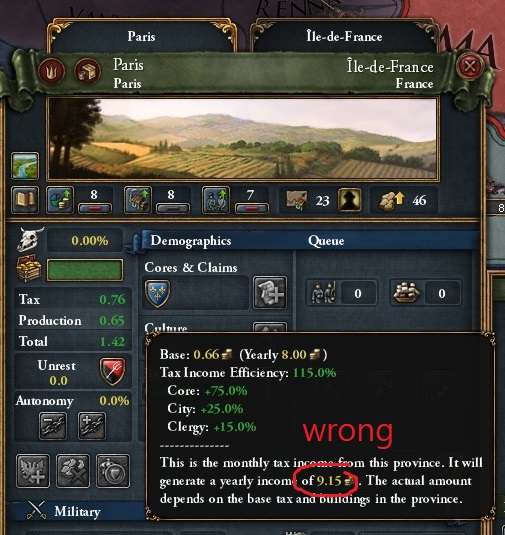
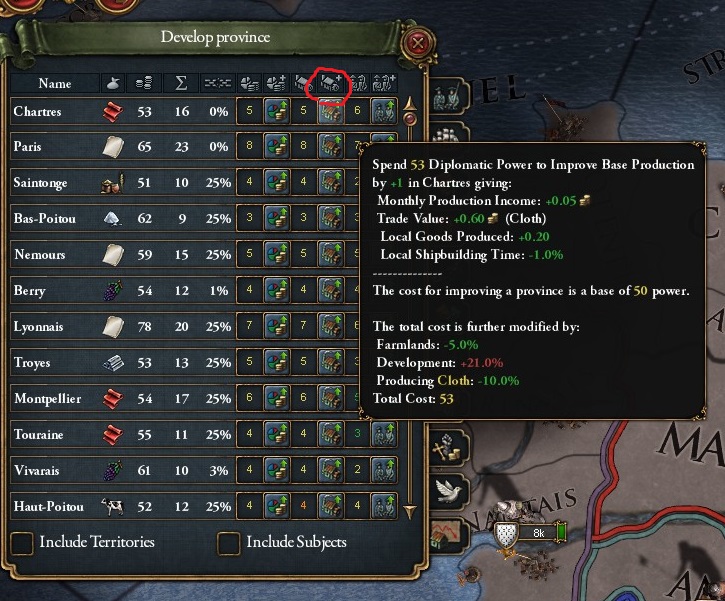
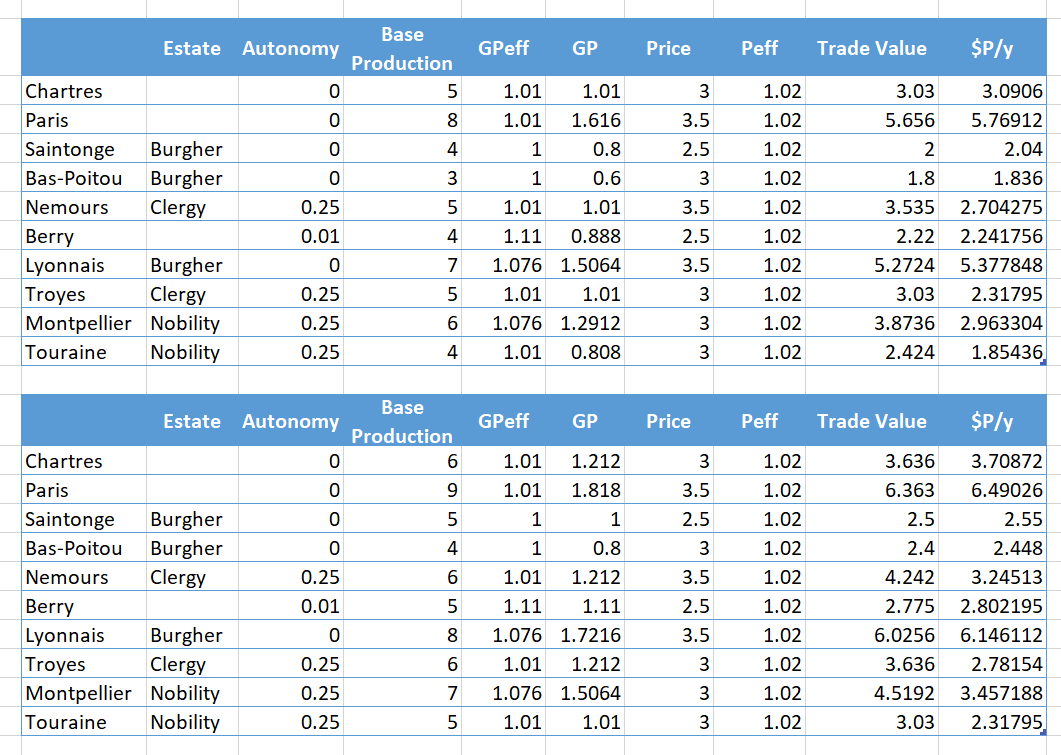
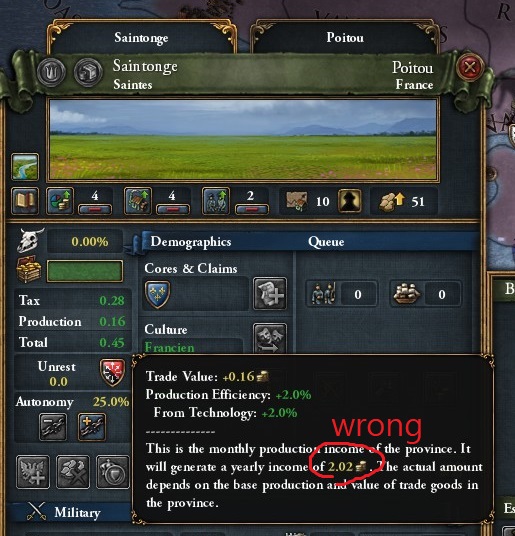
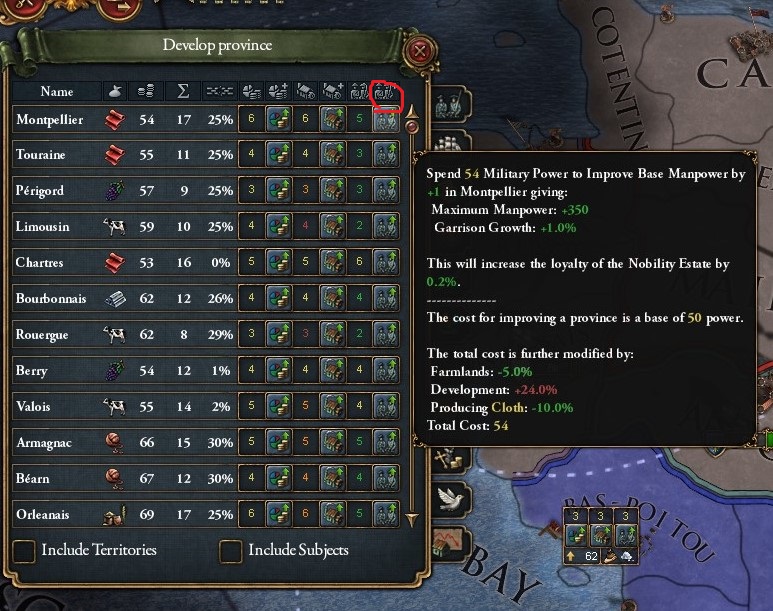
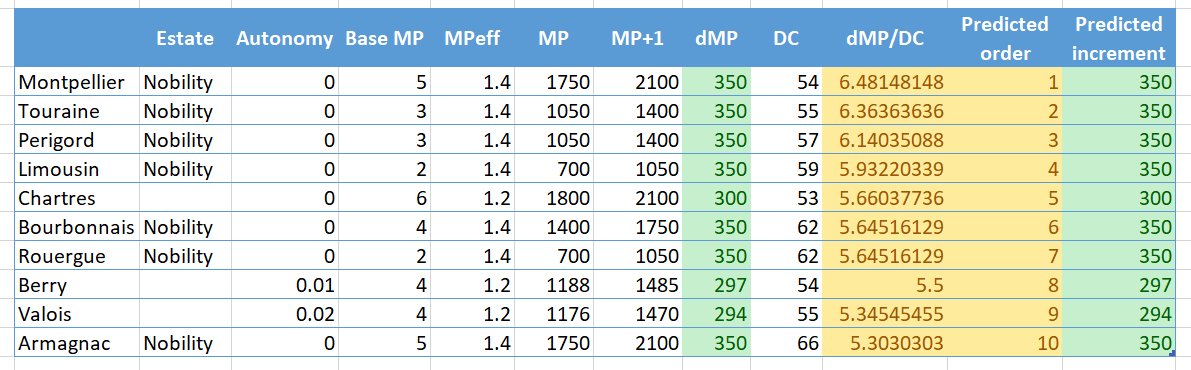
The title should be a question; Are develop-provinces production tab showing accurate statistics?

It's well written though. Would also recommend not doing this in separate posts but collab it all in one piece.
SkeL 2020年5月16日 2時44分 
1st What this guide actually helps with? The game already calculate all those numbers and give us the actual increasing of tax/manpower/whatever.

2nd Why dont you add all your guides together instead of making a guide for each subject? There's a way to add different topics in a single guide, dont need to spread it all over steam lol
garbage_bin_2 2020年5月6日 17時30分 
A little addition about developing production. Consider trade good in a province before developing. Grain, livestock wool are almost usless, upgrading its production makes almost no profit. Go for hight value goods and ofc gold if you have some.